LabVIEW Tutorial: Demo & Example
LabVIEW is simple to use and a straightforward demo can easily provide some of the main steps required in starting a LabVIEW programme.
Logic Probe Tutorial Includes:
What is LabVIEW?
LabVIEW environment
LabVIEW VIs
Programming
Drivers
Example / tutorial
Straightforward LabVIEW demonstrations are able to demonstrate the basic principles behind LabVIEW programming and act as a useful tutorial.
The demonstration below how LabVIEW can be used to quickly read five channels of data from a USB data acquisition device and write the measurements to a file.
This type of demonstration / tutorial is useful because it is the type of routine that is often required within LabVIEW.
Opening LabVIEW
With the computer turned on and booted up ready to go, the first stage in the tutorial or demonstration is to open LabVIEW, and then select File >> New VI.
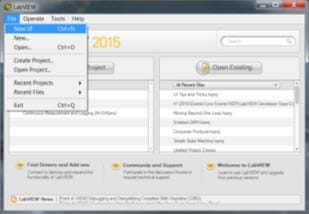
This will open up a new LabVIEW VI or Virtual Instrument. Unlike traditional instruments, a VI doesn’t have fixed functionality meaning it can adapt as a project expands.
The front panel and block diagram of the VI will open. The front panel has a grey background and is where the user interface of the VI is created. The block diagram is white and is where the code that defines the application is added.
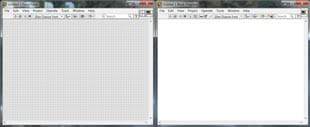 LabVIEW screen showing VI Front Panel & Block Diagram
Add graph to front panel
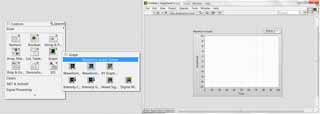
The next step in this tutorial is to put a graph on the front panel that can show the acquired data. To do this, right-click on the front panel to bring up the Controls Palette. Select Silver >> Graph >> Waveform Graph (Silver) and place the item on the front panel.
The Controls Palette has many click and drop controls and indicators that can be used to quickly build a user interface. This is a huge advantage over text-based languages where user interfaces can be very time consuming.
Select block diagram
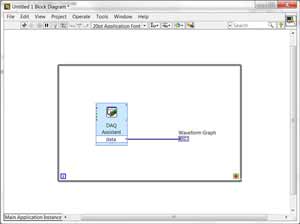
The next step in this LabVIEW tutorial and demonstration is to select the block diagram. There is now a ‘terminal’ for the waveform graph that allows data to be wired in to show on the front panel. To get data to display in the graph a LabVIEW function is needed to read data from the USB data acquisition (DAQ) device.
To do this, right-click on the block diagram to open the Functions Palette and select Measurement I/O >> NI-DAQmx >> DAQ Assistant to put the function on the block diagram. DAQmx is a hardware driver and there are hundreds of third party drivers available for LabVIEW.
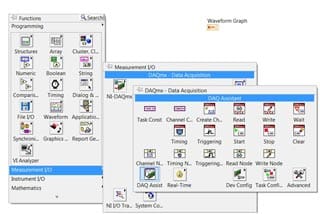
The DAQ assistant is a configuration-based function. This means that a configuration wizard will appear to select the data channels when the function is placed on the block diagram. These configuration-based functions are called Express VIs and they are used to speed up development time for simple programs.
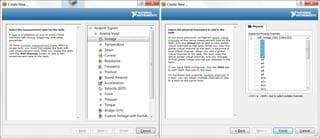
The first configuration window allows the type of measurement to be selected. The second window shows the hardware and channels that can be selected. Simple hardware integration is another advantage of LabVIEW.
In this example a piece of hardware called USB_Voltage_DAQ is being used and 5 channels (a0 to a4) are being read.
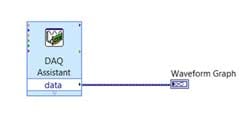
The final window configures each channel to be read. Here the range, number of samples to read, acquisition rate etc can be selected. Once configured, clicking OK will put the DAQ Assistant function on the block diagram. The function has an output called ‘data’. By clicking on the output of the DAQ Assistant function and then input of the Waveform Graph indicator a wire is created that will pass the data from the function to the front panel indicator when the program runs.
Notice the colour of the Waveform Graph indicator has changed colour. This is due to the data type changing from a double (orange) to a dynamic data type used by Express VIs.
 LabVIEW connecting wires
The program can be run by clicking the white run arrow in the top left of the block diagram or front panel. When the program runs, the pre-configured number of samples for each of the five channels are read from the hardware and displayed in the graph.
To make this data acquisition repeat continuously a loop is needed. To add a loop, right-click the block diagram to open the Functions Palette. Select Programming >> Structures >> While Loop. Drag the loop around the DAQ Assistant function and the indicator. All the code within the loop will execute repeatedly until it’s told to stop.
 LabVIEW Contextual Help
A front panel button can be used to stop the loop. Right click the red stop terminal in the bottom right of the while loop. Select ‘create control’ and a stop button terminal is created on the block diagram. A corresponding stop button is added to the front panel. Now when the program runs it will stop when the user pressed the button.
Filter data
The next step of developing the programme in this LabVIEW tutorial and demonstration is to filter the data by adding the Digital IIR Filter function to the block diagram. This is located in Signal Processing >> Waveform Conditioning >> Digital IIR Filter on the Functions Palette. Delete the data wire so the filter can be added.
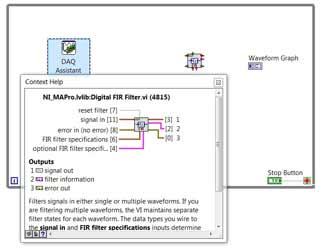
Sometimes it is hard to know which terminal on a function to wire data into or what terminal to read. LabVIEW has a tool called context help to make this easy. It can be used by pressing Ctrl-H. Hover the mouse over the Digital IIR Filter function to get a comprehensive overview of each terminal and what the function does.
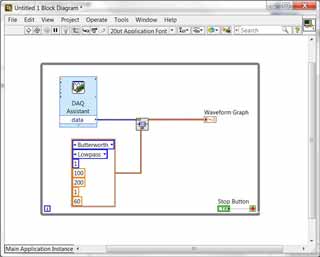
Wire the data output of the DAQ Assistant to the Signal In input on the filter function. Wire the Signal Out output to the Waveform Graph. Right click on the FIR Filter Specifications terminal and select ‘create constant’. The constant that is created is the configuration settings for the Digital IIR Filter and can be changed by clicking on each constant. Context Help can be used to determine what all of the options are.
Write data to measurement file
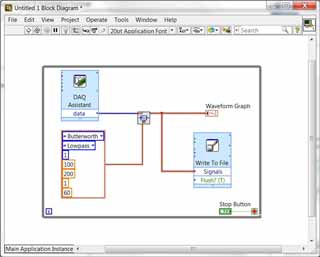
The last step is to write the data to a measurement file. The function to do this is located at Programming >> File I/O >> Write to Measurement File on the Functions Palette. This is an Express VI so a configuration window will appear when the function is placed inside the loop Use the configuration window to select the file save location, the type of file to create etc. Click OK and wire the filtered data into the Signals input on the Write to Measurement File function.
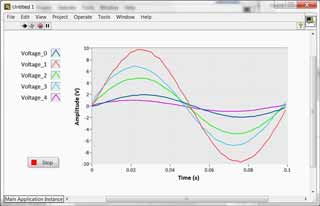
The program is now finished! When the run arrow is clicked the program will continuously acquire data until the user pressed the stop button. All of the data will be saved in a file that can be opened when the program has been stopped.
In this example a few minutes extra was spent to tidy the front panel to make it more user friendly and attractive.
 Written by Ian Poole .
Experienced electronics engineer and author.
More Test Topics:
Data network analyzer
Digital Multimeter
Frequency counter
Oscilloscope
Signal generators
Spectrum analyzer
LCR meter
Dip meter, GDO
Logic analyzer
RF power meter
RF signal generator
Logic probe
PAT testing & testers
Time domain reflectometer
Vector network analyzer
PXI
GPIB
Boundary scan / JTAG
Data acquisition
Return to Test menu . . .