LabVIEW Programming
LabVIEW is programmed in a graphical environment to provide a simple approach to generating programmes for complex environments.
Logic Probe Tutorial Includes:
What is LabVIEW?
LabVIEW environment
LabVIEW VIs
Programming
Drivers
Example / tutorial
LabVIEW programming utilises graphical techniques and in this way, it is much easier to build representations that can be viewed in a similar way to the actual flow of the process.
Like any other language, LabVIEW programming requires a learning process and practice to achieve the maximum effectiveness and speed.
Nevertheless it is possible to achieve quick results with the knowledge of two main concepts: G programming (block diagram elements); and dataflow.
LabVIEW programming elements
LabVIEW programming is undertaken on the block diagram of the Virtual Instrument. G programming is a technical name for the LabVIEW programming language but nowadays the term is largely unused and the name LabVIEW has become to mean the language as well as the software itself.
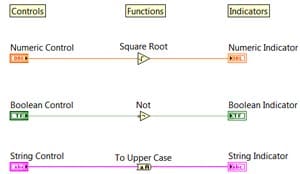
As with all programming languages, there are inputs, actions, and outputs. In LabVIEW programming these are known as Controls, Functions and Indicators.
- Controls: Any LabVIEW control on the front panel will have a corresponding element on the block diagram. The user can input data into the control for use within the overall programme. It is possible to connect the controls to a function to perform a particular action. Controls can come if different data types: single, double, string, etc . . the standard programming data types.
The Controls palette can be accessed from the front panel window by selecting View » Controls Palette. Alternatively it can be accessed by right clicking on any empty space in the front panel window.
The Controls palette for LabVIEW programming is broken into various categories – these can be exposed as required to show some or all of these categories to suit the requirements for the application. - Functions: LabVIEW functions are taken from the Functions palette on the block diagram and are given inputs and they perform an action on this. LabVIEW has a huge range of different functions ranging from simple mathematics to video processing, spectral analysis and the like.
- Indicators: LabVIEW indicators are similar to controls, having a Front Panel Counterpart in which they display the output of the block diagram to the user.
Within the block diagram all the LabVIEW programming elements, i.e. controls, indicators and functions, are connected together. This is achieved using “wires.” The data can be considered to flow along these wires.
There are different wire types which are indicated by the colour and style of the representation.
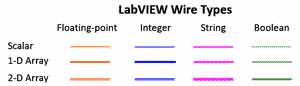
Each wire has a single data source, but it is possible to wire it to many VIs and functions that read the data. Wires are different colors, styles, and thicknesses, depending on their data types as shown above. They may be:
- Numeric integer (Blue)
- Numeric floating point (Orange)
- Boolean (Green)
- String (Pink)
The appearance of the wire indicates whether it is scalar, a 1D array, or a 2D array.
On a LabVIEW screen, a broken wire appears as a dashed black line with a red X in the middle. Broken wires occur for a variety of reasons. One common reason is when wiring two objects with incompatible data types.
LabVIEW dataflow & programming
With text based programming the order of execution is set up by the order of the lines – they are executed in a sequential manner. Examples of these languages include Visual Basic, C++, Java and many others.
With graphical programming it is set by the dataflow within the diagram. Within this concept a function is not able to execute until it has received all its inputs. Once it has all of its inputs, it executes its functions and passes on its output to the next node.
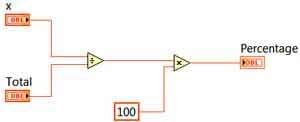
In the diagram below data flows from left to right and this means that the multiplication function cannot execute until the divide function has completed. Therefore the order of execution has been set. It should be noted that the execution follows the actual dataflow and not the position within the window.
The concept of dataflow within LabVIEW may take those who are more used to text based programmes a little while to master, but once this has been done, it is easy to use as a programming language.
 Written by Ian Poole .
Experienced electronics engineer and author.
More Test Topics:
Data network analyzer
Digital Multimeter
Frequency counter
Oscilloscope
Signal generators
Spectrum analyzer
LCR meter
Dip meter, GDO
Logic analyzer
RF power meter
RF signal generator
Logic probe
PAT testing & testers
Time domain reflectometer
Vector network analyzer
PXI
GPIB
Boundary scan / JTAG
Data acquisition
Return to Test menu . . .