What is Noise Figure - measurement & formula
Noise figure is a measure of the degradation in signal to noise ratio and it can be used in association with radio receiver sensitivity and it is an essential element of the RF circuit design of any radio receiver.
Home » Radio & RF technology » this page
Radio Receiver Sensitivity Includes:
Receiver sensitivity basics
Signal to noise ratio
SINAD
Noise Figure, NF
Noise floor
Reciprocal mixing
Noise figure is a number by which the noise performance of a radio receiver, amplifier, mixer or other circuit block can be specified. The lower the value of the noise figure, the better the performance.
Essentially the noise figure defines the amount of noise an element adds to the overall system. It may be a pre-amplifier, mixer, or a complete receiver. Often the noise figure may be used to define the performance of a receiver and in this way it can be used instead of the signal to noise ratio.
In view of its widespread applicability, noise figure is a particularly important parameter for a wide variety of radio communications systems from fixed or mobile radio communications systems, two way radio communications systems, and satellite radio communications systems.
Noise figure is a parameter which is often used in the RF circuit design of radio receivers to understand the noise performance of any radio being developed, or the performance of one that may need to be selected for any system, etc.
Noise performance measurements
There are many ways in which the noise performance of a radio receiver can be specified. Signal to noise ratio is the most obvious and along with it there is a SINAD (SIgnal to Noise And Distortion). There are other methods of looking at the sensitivity performance including Bit Error Rate, and so forth.
However it is noise figure that become one of the more important parameters associated with radio receiver performance because t can be used for the overall system as well as elements of it.
By using the noise figure, the different elements can be analysed and an overall figure calculated.
It is all associated with the level of noise introduced. It is a sad reality that noise is always present to a greater or lesser degree in any circuit.
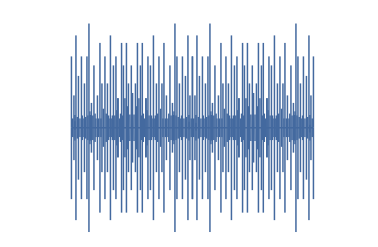
Noise extends over all frequencies and it is introduced by elements of the circuit - the electronic components, etc. Accordingly the choice of components can have a major impact on the noise performance of the circuit.
Most of the noise, but not all, in radio receiver circuits is thermal noise. It is for this reason that some specialist applications like radio astronomy where exceedingly low noise levels are required to detect minute signals, the input circuits may be cooled to very low temperatures to reduce the thermal noise.
Whilst thermal noise is the major source of noise, there are also other mechanisms that create noise and these need to be considered when undertaking the RF circuit design to ensure that circuit configurations, electronic components and techniques can be chosen to minimise the overall noise.
Note on the Electrical / Electronic & RF Noise:
Noise is present in all electronic and RF circuits. It presents a limitation on many aspects of performance. Noise arises from many causes and sources. Understanding what forms of noise are present and enables the system performance to be tailored to ensure the effects of the noise can be minimised.
Read more about Electrical / Electronic and RF Noise.
Noise factor & noise figure basics
Essentially the measurement assesses the amount of noise each part of the system or the system as a whole introduces. This could be the radio receiver, or an RF amplifier for example. If the system were perfect then no noise would be added to the signal when it passed through the system and the signal to noise ratio would be the same at the output as at the input.
As we all know this is not the case and some noise is always added. This means that the signal to noise ratio or SNR at the output is worse than the signal to noise ratio at the input. In fact the noise figure is simply the comparison of the SNR at the input and the output of the circuit.
There are two basic figures that can be used:
- Noise factor: The noise factor can be derived simply by taking the SNR at the input and dividing it by the SNR at the output. As the SNR at the output will always be worse, i.e. lower, this means that the noise factor is always greater than one. The noise factor is rarely seen in specifications.
- Noise figure: Noise figure is the parameter that is seen widely in specifications and in use when defining radio receivers and the elements within the receiver systems. The noise figure uses a logarithmic scale and is simply the noise factor expressed in decibels.

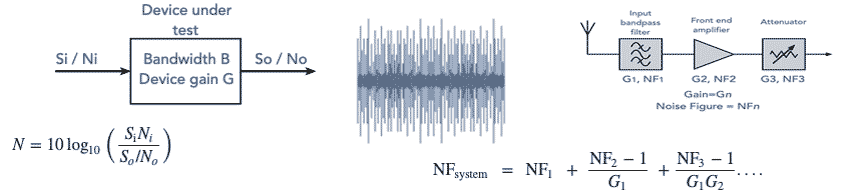
Noise figure formula & calculation
Using the diagram above, it is possible to determine the noise figure formula from the conditions described above.
Where
Si is the signal at the input
Ni is the noise at the input
So is the signal at the output
No the noise at the output
As an example if the signal to noise ratio at the input was 4:1, and it was 3:1 at the output then this would give a noise factor of 4/3 and a noise figure of 10 log (4/3) or 1.25 dB. Alternatively if the signal to noise ratios are expressed in decibels then it is quite easy to calculate the noise figure simply by subtracting one from another because two numbers are divided by subtracting their logarithms. In other words if the signal to noise ratio was 13 dB at the input and only 11 dB at the output then the circuit would have a noise figure of 13 - 11 or 2 dB.
Noise figure for cascaded stages
In any RF circuit design, several stages are likely to be connected together - a typical radio receiver will have the input tuning, an RF amplifier, possibly an RF attenuator, an RF mixer, and so forth.

The first stages will tend to define the overall noise figure and hence the noise performance of the overall RF circuit design.
Take for example an RF circuit design for two stages: the input itself will have noise equal to kTB and this will be amplified by the gains, G1 and G2 for both stages. There will be the noise from the first stage and this will be amplified by the second stage, and finally there will be the noise from the second stage. The noise powers can be added because they are not correlated.
However it is often necessary as part of the RF design process to calculate the effect of the noise performance of different stages on the overall noise figure.
Where:
NF = Noise figure for a system or for stage 1, 2, 3, as denoted by the subscript
G = gain for a given stage as denoted by the subscript.
The noise figure formula for series or cascaded stages shows that the stage that has the main effect on noise figure for the whole RF circuit design is the first stage. The noise contribution from this stage is amplified by the subsequent stages and as a result the subsequent stages contribute less to the noise as the signal levels are larger.
Noise figure measurement
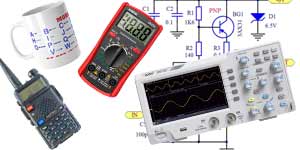
The noise figure of an element used in a radio communications system can be measured in a variety of ways. A variety of different test instruments can be used. In fact, the method used can be determined by what test instruments are available.
Noise figure measurement meter: In some laboratories a specific noise figure meter may be available. A number of manufacturers make these items of test equipment and they provide a quick, easy and accurate noise figure measurement.
Noise figure analyzers provide a very quick and easy method of determining the noise figure of an item, and in addition to this, they are also accurate, making them an ideal solution if they are available.
The measurements are very easy requiring the input and also the output of the circuit under test being connected to the noise figure meter. The test instrument is set up, the test is initiated and results are provided. Very simple, but accurate test.
- Spectrum analyzer noise figure measurement: It is relatively easy to make noise figure measurements using a spectrum analyzer. Some of these test isntruments have built in routines to enable them to make noise figure measurements.
There are two main methods that can be used for measuring noise figure, both of which can use a spectrum analyzer. They are called the gain method and the Y method.
Note on the Noise Figure Measurements using a Spectrum Analyzer:
Spectrum analyzers can easily be made to make relatively accurate noise figure measurements. Some analyzers even have built in routines to enable them to make noise figure measurements.
Read more about Noise Figure Measurements using a Spectrum Analyzer.
Noise figure examples
The specifications of different pieces of equipment used for different types of radio communications systems will vary quite widely.
A typical professional or ham HF radio receiver may have a noise figure of 15 dB of more and function quite satisfactorily. A better level of performance is not necessary because of the high level of atmospheric noise. At low frequencies, atmospheric noise can be very high, and even at frequencies of around 30 MHz where the spectrum is bordering on VHF, interference levels can still be high enough not to warrant very high levels of noise performance.
However receiver used for narrow band applications at VHF or above might have a noise figure of 3 or 4 dB. Some narrow band RF amplifiers often have a noise figure of around 1 dB. However it is interesting to note that even the best professional wide-band VHF UHF receivers may only have a noise figure of around 8 dB. These radio receivers might be used for spectrum monitoring or for various forms of radio communications or radio reception.
Particularly high levels of performance are needed for applications like radio astronomy at frequencies extending into the UHF portion of the spectrum and beyond.
Noise figure is a very convenient parameter to use as it is able to provide information about the noise performance of a variety of different elements within a system. The use of noise figure also enables the overall performance of a system to be calculated from a knowledge of the noise figure of each element and the gain levels. This means that the system noise figure can be easily calculated and optimised. Often radio communications equipment used for professional or ham radio applications will have noise figures quoted as part of their overall specification.
 Written by Ian Poole .
Experienced electronics engineer and author.
More Essential Radio Topics:
Radio Signals
Modulation types & techniques
Amplitude modulation
Frequency modulation
OFDM
RF mixing
Phase locked loops
Frequency synthesizers
Passive intermodulation
RF attenuators
RF filters
RF circulator
Radio receiver types
Superhet radio
Receiver selectivity
Receiver sensitivity
Receiver strong signal handling
Receiver dynamic range
Return to Radio topics menu . . .